CHAPTER 01
What's in the box.
A single sensor, a USB-C cable, and the bits you need to attach it to a machine. The Balancer kit adds a clip-on IR tachometer and a strip of reflective tape.
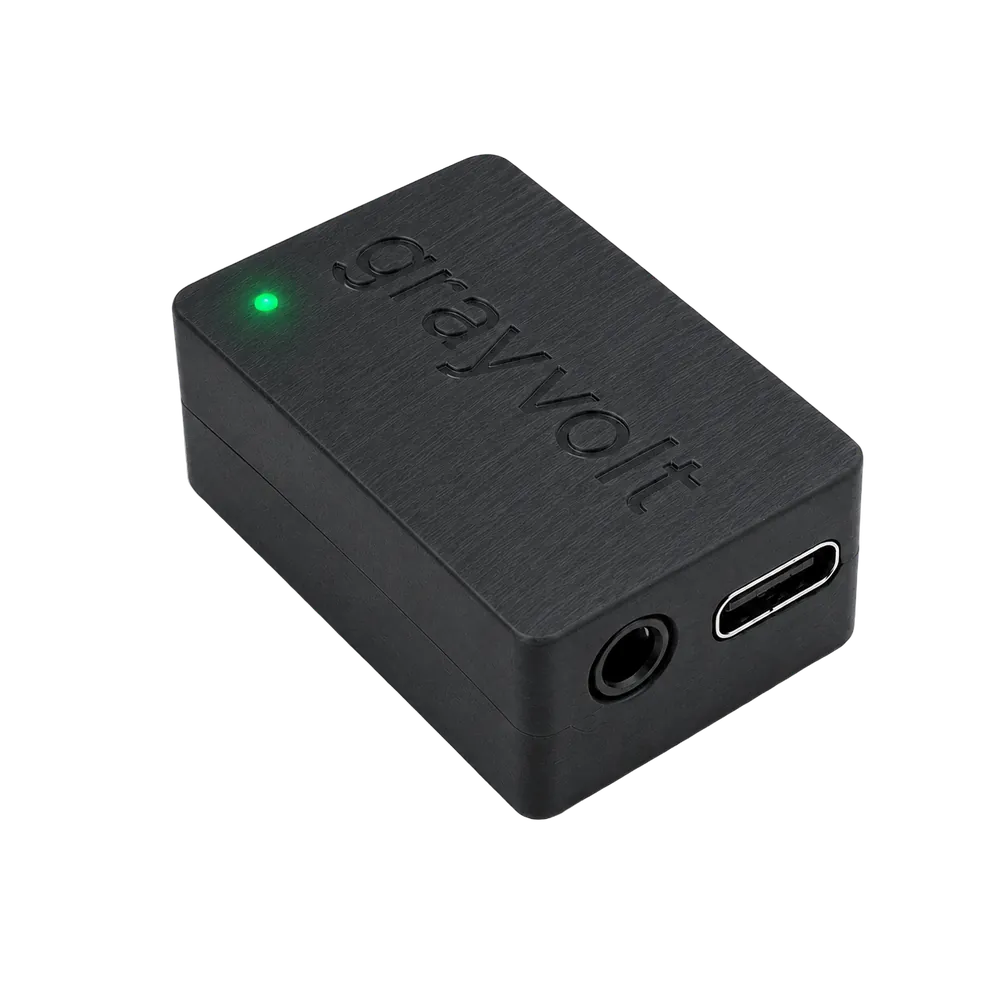
The sensor, up close
- A
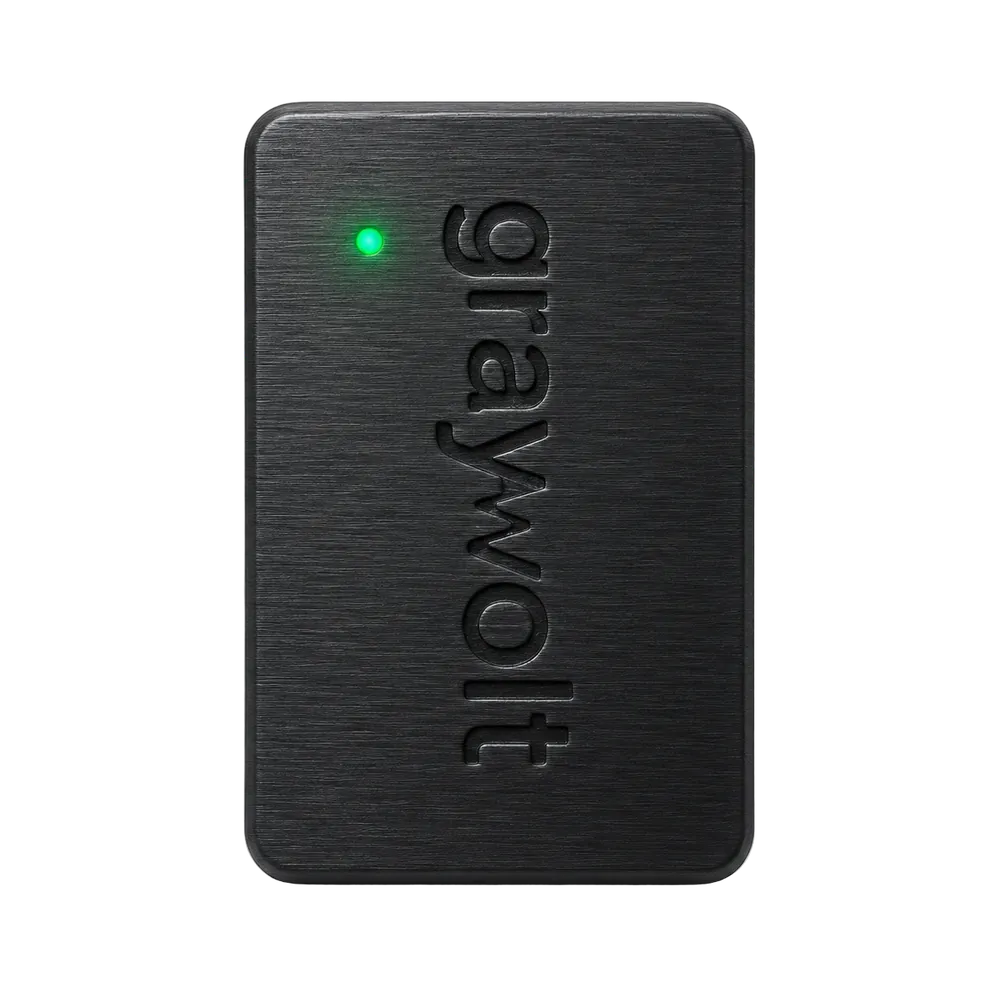
Status LEDTop-face. Red on boot → amber while the radio comes up → solid green when the captive portal is live.
- B
3.5 mm tach inputBalancer kit only. Accepts the bundled IR tach sensor. TRS; signal on tip, power on ring, GND on sleeve.
- C
USB-C power5 V, 200 mA typical. Any phone charger, laptop port, or battery bank works. No data link — power only.
- D
Magnetic baseNeodymium. Holds firmly to any ferrous housing. For aluminum or plastic, use the bundled VHB strip.
A · Status LED
Green means go
Solid green = running, portal live. Slow pulse = AP idle. Red = boot or fault.
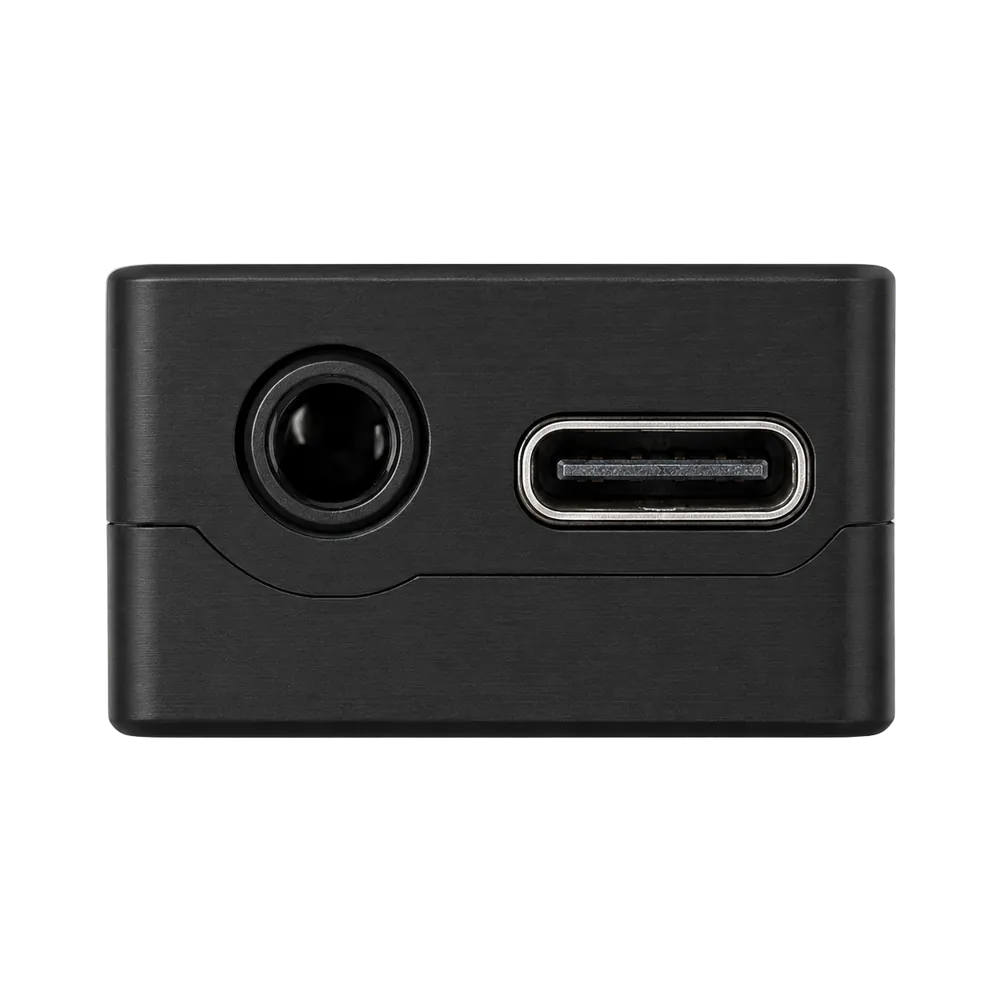
B · C · Ports
Tach in, power in
3.5 mm for the IR tach (Balancer kit). USB-C for 5 V power.
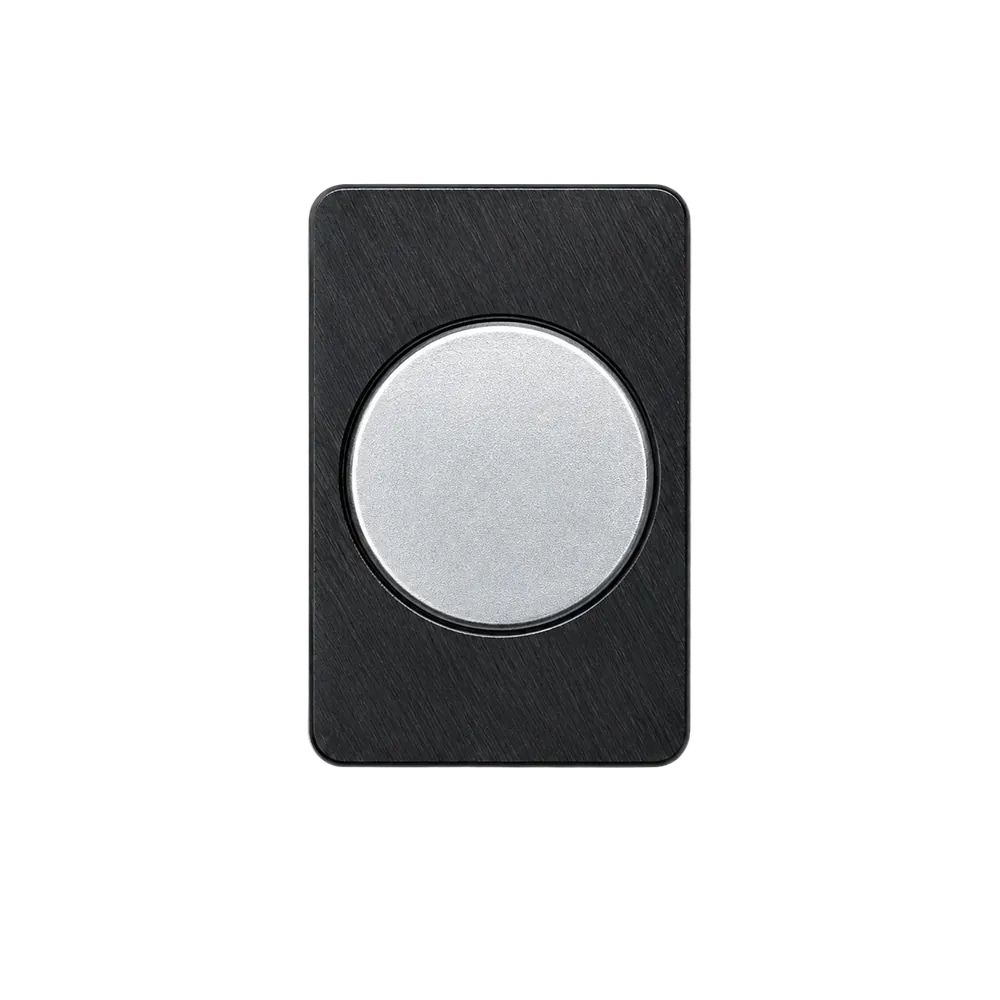
D · Base
Stick or clamp
Magnetic base for ferrous housings. VHB adhesive pad included for everything else.
CHAPTER 02
Mount and power.
Fifteen minutes, five steps. Get the sensor onto the machine and the LED solid green.
01
Pick a mounting location
As close to the spindle bearing housing as possible. Radial (perpendicular to the shaft) gives the cleanest 1× signal for balancing. Axial works for general health monitoring.
02
Clean the surface
Isopropyl alcohol, clean rag, 30 seconds. Skip this and the VHB peels off by end of week. Magnetic mount is forgiving; adhesive isn't.
03
Attach the sensor
Ferrous housing: drop it in place — the neodymium base grabs hard. Aluminum, plastic, or composite: peel the VHB backing and press firmly for 10 seconds.
04
Attach the tach (Balancer only)
Clip the IR sensor to the spindle housing, eye pointed at a single 10 mm strip of reflective tape on the rotating shaft. Plug the 3.5 mm cable into the sensor's TACH port.
05
Plug in USB-C
LED cycles red → amber → green. Solid green means the Wi-Fi access point is live and accepting connections.
CHAPTER 03
Connect your phone.
The sensor runs its own Wi-Fi access point and a captive portal. No app. No account. No internet.
STEP 01
Open Wi-Fi settings
On iOS: Settings → Wi-Fi. On Android: Network & internet → Internet. You'll see a network named GV-#### — the four characters are your device's unique ID, printed on the label. Connect to that network.
Wi-Fi
OTHER NETWORKS
GV-7A3F›
ShopFloor_5G🔒›
Guest-WiFi›
STEP 02
Join the sensor's network
Tap GV-#### (your device number). No password. The captive portal should open automatically — if it doesn't, navigate directly to http://gv-####.local in your browser.
Wi-Fi
Connected. No Internet required — this is the sensor's local network.
STEP 03
The dashboard opens
The captive portal loads the measurement dashboard in your phone's built-in browser — the same UI you'll see embedded throughout the rest of this guide. Nothing to install. Close the page to disconnect.
CHAPTER 04
Live — your home base.
The page that loads when the captive portal opens. Purpose: confirm the sensor is reading correctly and know in three seconds whether the machine is running clean. Everything below is the actual UI — the iframe is live and animating.
http://gv-####.local/#live
Live · streaming
Scroll inside the frame. RPM and RMS update ~10× per second.
What to look for
VerdictThe pill top-right
Plain-English summary of the current vibration. Three states: Low, Elevated, High — investigate. Driven directly from live RMS.
TachPulsing dot next to "Tach"
Flashes once per shaft revolution. If it isn't pulsing, the IR tach is unplugged, mis-aimed, or the reflective tape is too dirty to trigger.
RPM cardShaft speed, 1× tach
Read directly from the optical tach, not inferred from vibration peaks. Phase, period, and Δ-since-last-frame sit beneath the big number.
RMS cardOverall vibration in g
Plus peak, crest factor, and chassis temp. Crest > 4.5 flags impact-type faults (bearing defects, loose fasteners).
Per-axisX · Y · Z amplitudes
Dominant axis is highlighted in lime. Radial imbalance shows on X+Y; axial issues on Z. Tells you where the energy is concentrated.
WaveformThree-axis time-domain trace
Rolling window. Toggle X/Y/Z on/off via the buttons. Save the current frame as PNG with the PNG button — useful for service tickets.
Raw captureFull 6660 Hz recorder
Records X/Y/Z at the sensor's full rate (1–60 s), then downloads as CSV. For offline analysis in MATLAB, Python, or Excel. Drag-zoom the preview to inspect any window.
Spectrum previewMini FFT, bottom-right
Live frequency content at a glance. Click Open for the full Spectrum view with 4× the resolution and order tracking.
How the verdict is computed
Low< 0.05 g RMS
Running clean
Elevated0.05 – 0.15 g RMS
Worth a look
High> 0.15 g RMS
Investigate
Baseline matters more than absolute numbers. Every machine has its own healthy RMS — a production router at 0.08 g might be perfectly normal, while a finishing spindle at 0.08 g is already telling you something. Let the sensor run for a shift and use the trend card on the Live view as your real reference.
CHAPTER 05
Spectrum & diagnosis.
Where you go to diagnose what is wrong, not just that something is wrong. The FFT shows you the frequency content; harmonic tracking watches the 1×/2×/3×/4× lines over time so a developing fault is visible before it dominates the spectrum.
http://gv-####.local/#spectrum
Spectrum · 0–3,330 Hz
Showing a bearing-fault signature — note the 4× ramp.
Magnitude plotTop — 512-point FFT
Drag-zoom to focus on a band. Double-click to reset. Toggle between g and mm/s; switch axes X / Y / Z / All.
Resolution256 / 1k / 2k / 4k bins
Bigger window = finer frequency resolution but slower update. 1k is the sweet spot for live use; 4k for chasing a specific bearing fault.
Reference overlay"Save as reference"
Snapshot the current spectrum. The live trace then draws on top of it so you can see a before/after at a glance.
FFT recordingRecord & replay
Captures every FFT frame for 1–300 s, then lets you scrub through them with the playback slider (½× … 20× speed). Export the whole capture as CSV.
Harmonic tracking1× · 2× · 3× · 4× of RPM
Each multiple of running speed is tracked separately over 60 s / 1 h / 24 h / 7 d. A single trace creeping up is a stronger fault signal than overall RMS rising.
Diagnosis hintsRight-side panel
Each harmonic has a default cause and a severity pill: 1× → imbalance, 2× → misalignment / loose mount, 3× → looseness, 4× → bearing wear. Severity escalates when a trace rises sustainedly.
Reading the harmonic tracker. A flat, low set of traces means a healthy machine. A single 1× line that climbed over a week → mass imbalance crept in (chip buildup, broken cutter tooth). A 4× trace doubling in 24 hours → a bearing race is starting to spall. The whole point is to catch it before the RMS verdict ever turns yellow.
CHAPTER 06New in v2.7
Gyro — torsional vibration.
The accelerometer measures how the housing shakes in a straight line. The on-board gyroscope measures how it twists — angular-rate vibration the accelerometer simply can't see. Useful for torsional resonance, coupling backlash, and gear-mesh problems that show up as rotation, not translation.
http://gv-####.local/#gyro
Gyro · 0–833 Hz
Angular-rate spectrum and waveform, in °/s. Drag to zoom a band.
Avg rotationTorsional RMS in °/s
Overall angular-rate level across the 0–833 Hz band. The hero number — rising torsional RMS means something is twisting that shouldn't be.
Vibration RMSLinear accel, for comparison
The same broadband g RMS from the Live view, shown side-by-side so you can tell whether a problem is translational, torsional, or both.
Gyro spectrumFFT in °/s, X / Y / Z / All
1.66 kHz sample rate → a clean 0–833 Hz band. Dominant frequency, peak amplitude, and rate are called out in the header. Drag to zoom; double-click to reset.
WaveformTime-domain angular rate
Mean-subtracted °/s trace. Good for spotting once-per-rev torsional kicks — backlash slamming, a loose key, a cracked coupling.
Raw captureRecord °/s to CSV
Same recorder as the Live tab, but for angular rate. Pick axes and sample rate; fewer axes or a lower rate buys you a longer recording at the same PSRAM cost.
Housing-mounted, this is torsional vibration — not shaft RPM. The gyro reads how the sensor body rotates in space. Bolted to a machine housing it captures torsional vibration transmitted through the structure; it is not a substitute for the optical tach, which reads true shaft speed from a mark on the rotor. The gyro pauses automatically during a balance run or a raw capture and resumes on its own.
CHAPTER 07New in v2.7
Analyzer — condition monitoring.
A one-tap health check that needs no tachometer. Spin the machine, hit Analyze, and the device reports an ISO 10816 severity zone, a tach-free running-speed estimate, and an envelope-demodulation screen for early bearing faults. This is the "is this machine OK?" button.
http://gv-####.local/#analyzer
Analyzer · condition monitoring
Pick a machine class, tap Analyze. Showing a bearing-fault scenario.
ISO 10816 zoneA / B / C / D severity
Velocity severity graded against the chosen machine class. A/B good, C watch, D act. The velocity in mm/s sits beneath it.
Machine classI – IV selector
Small (<15 kW), medium (15–75 kW), large rigid, large soft. Sets the thresholds the zone is graded against — pick the one that matches your machine.
Est. speedTach-free 1×
Running speed estimated from the spectrum's dominant order — no reflective tape or IR tach needed. Handy on machines you can't get a tach onto.
Bearing impulsivenessEnvelope kurtosis
A single number that rises when the signal gets impulsive — the signature of early bearing spalling. Around 3 is healthy/Gaussian; climbing past ~4–5 means impacts.
Envelope spectrumDemodulated defect peaks
Low-frequency peaks pulled out of the high-frequency bearing-impact band. Match them against your bearing's BPFO / BPFI / FTF rates to pinpoint which element is failing.
Live torsionalGyro section, always on
A condensed version of the Gyro view rolled in — torsional level, dominant frequency, and angular-rate peaks update live alongside the analysis.
Analyzer vs. Spectrum. Spectrum is for diagnosis — you read the harmonics yourself and decide what's wrong. Analyzer is for screening — it gives you a pass/fail-style verdict and flags bearing trouble without you needing to interpret an FFT. Use Analyzer for a quick walk-around health check; drop into Spectrum when something looks off and you want to know why.
CHAPTER 08Spindle Balancer kit
Run a balance job.
Single-plane influence-coefficient balancing through a four-step wizard. The device does the math; you handle the trial weight. Most jobs converge in two cycles.
Initial
Pick a capture duration (longer = better SNR) and a target ISO grade. Spin up to operating RPM and tap Measure. The 1× component is extracted at the live RPM.
Trial weight
Drag inside the polar to mark where you placed the trial weight, or type the exact mass + angle. Spin up again and re-measure. Now there are two vectors — enough to solve.
Correction
The wizard shows the calculated mass + angle, predicted residual, and an estimated quality grade. The placement helper can split the correction across weights you have on hand.
Verify
Place the correction, measure once more. The before/after panel shows the 1× reduction, ISO grade improvement, and per-axis change. Save to history when you're happy.
http://gv-####.local/#balance
Balance · interactive
Drag inside the polar to mark a trial position. Step through the wizard at the top.
Why the polar is the hero
You can see the imbalance, not just read it.
Most portable balancers print the answer as two numbers in a spreadsheet cell: "3.2 g at 214°." It works, but you're flying blind.
The polar shows the tech why. As each run completes, a new vector appears in the plot. You can watch how the machine responds to the trial weight, and see at a glance whether your correction is shrinking the imbalance or just moving it around — no mental math required.
The verify step makes the win obvious. The before/after panel overlays the two spectra, paints two arrows in the polar (red = before, lime = after), and shows the per-axis RMS dropping in tandem. If the green arrow is short and the spectrum overlay has collapsed at 1×, you're done. Save to history.
How good is "good enough?" The wizard's predicted-residual estimate is just that — an estimate. Your fixturing, trial-weight accuracy, and run-to-run repeatability set the real floor. If the residual has shrunk to a small fraction of the baseline and the refinement panel can't push it lower, you've hit your mechanical limit. Stop there, save the run, then watch the trend on the History page.
CHAPTER 09Spindle Balancer kit
Balance history.
Every saved balance run lives in flash on the device — up to 5,120 entries. Useful for tracking how a specific spindle drifts over its life, generating a customer report, or comparing two runs side-by-side.
http://gv-####.local/#history
History
Stats stripTotal runs, avg reduction, last run
A quick read on how the device has been used. Average-reduction is the headline KPI — over 80% is typical for shop work.
Reduction trendLast 50 runs
Each bar is one balance job's reduction percentage. A sequence of high bars means the workflow is dialed in; a dip means something changed about a setup.
Run tableDate / label / RPM / pre / post / correction
Filter by label to focus on one spindle or fixture. Click a row to compare its before/after spectrum against the live signal.
CSV exportDownload CSV
Full dump of all saved runs in spreadsheet form. Drops into Excel or any reporting tool without preprocessing.
CHAPTER 10
Log & trends.
A continuous record of RMS over the last 24 hours, sampled at a configurable interval. Set the baseline once, and the page shows you exactly when the machine started drifting from it.
http://gv-####.local/#log
Log
Sample countFilled / max
The log is a ring buffer; once it's full, the oldest sample is overwritten. Adjust the interval to control how much history fits.
BaselineHealthy RMS for this machine
Type in the value you know is "normal" for this spindle and click Set & save. The history chart paints a red band at +50% — anything above it is an alert.
IntervalSeconds per sample
Default 30 s gives you ~24 h of history. Drop it to 10 s for short-cycle troubleshooting; bump it to 60 s for an unattended run.
CSV exportFull ring buffer
Timestamp + RMS per row. Open in any tool that knows what a comma means.
CHAPTER 11
Fleet — many machines, one page.
If you have more than one GrayVolt on the same network, point any of them at the others. The Fleet view polls every device and shows status, RPM, RMS, and verdict in a single dashboard — no separate app, no cloud account.
http://gv-####.local/#fleet
Fleet
Add a deviceSerial, hostname, or IP
Type GV-FSS3, gv-fss3.local, or 10.0.0.42. mDNS resolves the serial form automatically when your network supports it.
Poll interval1–30 seconds
Every device is polled at this cadence. Faster = more responsive; slower = lighter on the AP. 2 s is a good default.
Device cardPer-machine tile
Shows live RPM, RMS, verdict, last-seen timestamp. Click a tile to jump to that device's full UI in a new tab.
Local-onlyNo cloud, no account
The device list lives in your browser. Nothing is sent off-network. If you want centralized reporting, point each device's STA mode at your plant SCADA host.
CHAPTER 12
Settings & calibration.
Wi-Fi, units, tach calibration, firmware update, and the upgrade-code field. The Settings page also surfaces device telemetry — uptime, free heap, CPU load — for diagnosing field issues.
http://gv-####.local/#settings
Settings
NetworkSSID scan + join
Scan for Wi-Fi, pick one, enter the password. The device joins the plant network and the captive AP stays available as a fallback. Currently-connected SSID / IP / RSSI are shown at the top.
Tach calibrationBalancer only
Live numeric ADC readout with auto-detect and a manual threshold slider. Spin the shaft by hand and watch the value cross the threshold — the modal walks through a three-edge verification before saving. Inline tuning is also available from the Verify step.
Firmware updateDrag-drop .bin or auto-check
Signed updates only. Auto-check polls the update server; if a newer build is available you can apply or skip. The previous firmware stays in the B partition for rollback.
Upgrade codeUnlock paid modules
Turns an Analyzer into a Balancer in the field — the Balance and History tabs appear on save. Reserved for future add-ons (BLE logger, cloud sync, two-plane balancing).
Device infoSerial, version, uptime, heap
Everything you need to attach to a support email. Updates every 2 s while you're on the Settings page.
Factory resetPower-cycle five times
Unplug and re-plug the USB-C cable five times in a row, waiting for the LED to come up between each cycle. On the fifth boot the device wipes Wi-Fi config only — log history and saved balance runs are preserved. No button needed.
CHAPTER 13
Troubleshooting.
The short list. If something here doesn't solve it, email the team — we read every message.
TachTach trigger dot isn't pulsing
The sensor isn't seeing pulses from the IR tach.
· Check the 3.5 mm cable is seated fully in the TACH port.
· Aim the IR head at the reflective tape, not the shaft itself. Standoff: 5–25 mm.
· In Settings → Tach calibration, watch the live ADC readout while you spin the shaft by hand. The number should swing cleanly between a high value (tape in view) and a low one (no tape). If it doesn't move much, the IR head is too close or the tape is dirty.
· Replace the tape. Old tape yellows and reflects inconsistently.
Wi-FiPhone connects, but no dashboard loads
The captive portal didn't intercept automatically.
· Open Safari or Chrome and navigate directly to http://gv-####.local or http://192.168.4.1.
· iOS caches DNS aggressively. Toggle airplane mode off/on.
· If the page loads but the connection pill says Reconnecting, you're probably on both the sensor AP and cellular — iOS sometimes routes the WebSocket through cellular. Turn cellular data off on that tab.
NoiseNoise floor is unusually high
The broadband floor between harmonics should be low and flat.
· Check the sensor is firmly seated. Loose mounts read as broadband noise.
· Remove VHB residue from the housing and re-mount. A clean surface is critical.
· If mounting on aluminum with the magnet, swap to VHB — a gap of even 0.5 mm adds a resonance around 800 Hz.
· Check the machine coolant isn't dripping on the sensor. The IP rating is splash-proof, not immersion-proof.
BalanceBalance job never converges
The correction weight doesn't reduce 1× after the solution run.
· Trial weight was too small — the trial response should be clearly distinguishable from the baseline. Try a larger trial weight.
· Run-to-run repeatability is poor. Something else is changing between runs: coolant on/off, ambient temperature, fixturing. Lock those down, then re-baseline.
· The imbalance is in a different plane. Single-plane balancing assumes the weight is concentrated axially; if the imbalance is distributed along the shaft, you need two-plane balancing (future firmware module).
LockoutLocked out of the AP — can't connect to set a new password
The device is in a Wi-Fi state you don't have credentials for — STA mode joined a network that's no longer around, or the AP password got changed and you've forgotten it.
Reset the Wi-Fi config with the USB-C cable. Plug the device in and back out five times in a row, waiting for the LED to come up between each cycle. On the fifth boot the device wipes its Wi-Fi config — you'll be back at the open GV-#### AP with no password set. Log history and saved balance runs are kept.
FleetA device shows "offline" but the LED is green
The polling browser can't reach the device on the network.
· If you used the gv-####.local form, mDNS isn't reaching across your network segment. Add it by IP address instead — check the Settings page on the target device for its current IP.
· If the device is on its own AP and your laptop is on the plant LAN, they're isolated. Put both on the plant LAN (Settings → Network) or both on the device AP.